Cities with the Highest Percentage of Hawaiian / Pacific Population in Maryland
RELATED REPORTS & OPTIONS
Hawaiian / Pacific
Maryland
Compare Cities
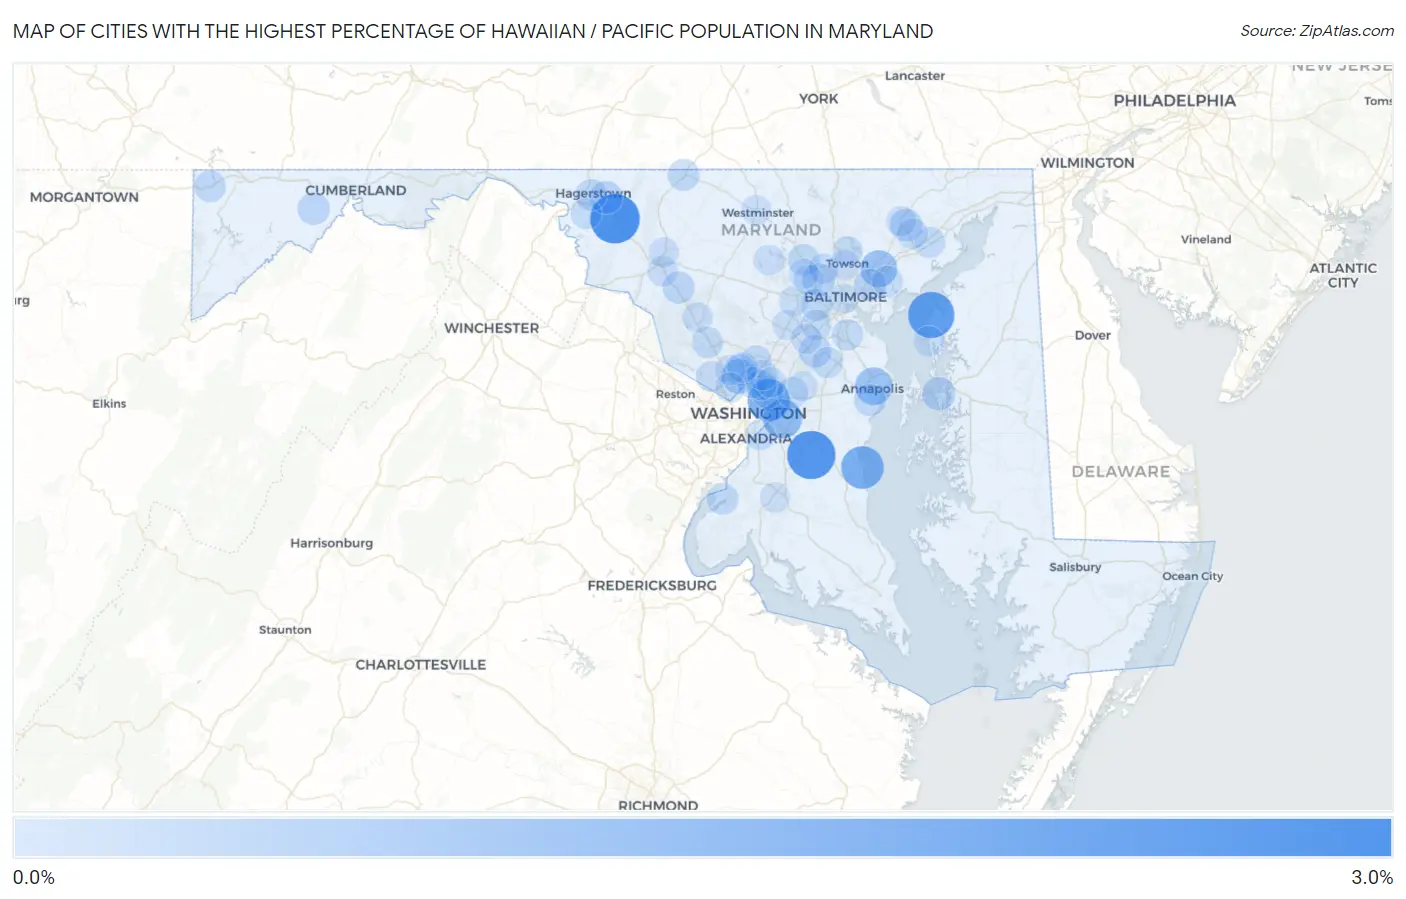
Map of Cities with the Highest Percentage of Hawaiian / Pacific Population in Maryland
0.0%
3.0%
Cities with the Highest Percentage of Hawaiian / Pacific Population in Maryland
| City | Hawaiian / Pacific | vs State | vs National | |
| 1. | Mount Lena | 2.9% | 0.051%(+2.86)#1 | 0.19%(+2.73)#316 |
| 2. | Croom | 2.7% | 0.051%(+2.66)#2 | 0.19%(+2.52)#337 |
| 3. | Tolchester | 2.4% | 0.051%(+2.36)#3 | 0.19%(+2.22)#368 |
| 4. | North Beach | 1.9% | 0.051%(+1.80)#4 | 0.19%(+1.66)#464 |
| 5. | Cottage City | 1.8% | 0.051%(+1.74)#5 | 0.19%(+1.60)#481 |
| 6. | Walker Mill | 1.3% | 0.051%(+1.28)#6 | 0.19%(+1.14)#609 |
| 7. | Naval Academy | 1.1% | 0.051%(+1.04)#7 | 0.19%(+0.903)#699 |
| 8. | Woodlawn Cdp Baltimore County | 1.1% | 0.051%(+1.02)#8 | 0.19%(+0.879)#707 |
| 9. | White Marsh | 1.0% | 0.051%(+0.955)#9 | 0.19%(+0.817)#736 |
| 10. | South Kensington | 0.62% | 0.051%(+0.571)#10 | 0.19%(+0.432)#1,088 |
| 11. | Grasonville | 0.45% | 0.051%(+0.400)#11 | 0.19%(+0.261)#1,335 |
| 12. | Lochearn | 0.44% | 0.051%(+0.393)#12 | 0.19%(+0.254)#1,356 |
| 13. | Robinwood | 0.40% | 0.051%(+0.349)#13 | 0.19%(+0.211)#1,443 |
| 14. | Bel Air | 0.34% | 0.051%(+0.288)#14 | 0.19%(+0.150)#1,620 |
| 15. | Fort Meade | 0.33% | 0.051%(+0.279)#15 | 0.19%(+0.141)#1,638 |
| 16. | Rosedale | 0.30% | 0.051%(+0.248)#16 | 0.19%(+0.110)#1,734 |
| 17. | Urbana | 0.30% | 0.051%(+0.248)#17 | 0.19%(+0.110)#1,735 |
| 18. | Midland | 0.29% | 0.051%(+0.235)#18 | 0.19%(+0.097)#1,779 |
| 19. | Hyattsville | 0.28% | 0.051%(+0.228)#19 | 0.19%(+0.089)#1,815 |
| 20. | Annapolis Neck | 0.26% | 0.051%(+0.209)#20 | 0.19%(+0.071)#1,891 |
| 21. | Catonsville | 0.26% | 0.051%(+0.207)#21 | 0.19%(+0.068)#1,899 |
| 22. | Emmitsburg | 0.25% | 0.051%(+0.198)#22 | 0.19%(+0.060)#1,933 |
| 23. | Owings Mills | 0.25% | 0.051%(+0.195)#23 | 0.19%(+0.057)#1,942 |
| 24. | Friendsville | 0.24% | 0.051%(+0.193)#24 | 0.19%(+0.055)#1,951 |
| 25. | Hagerstown | 0.23% | 0.051%(+0.182)#25 | 0.19%(+0.044)#1,995 |
| 26. | Colesville | 0.20% | 0.051%(+0.154)#26 | 0.19%(+0.016)#2,109 |
| 27. | Indian Head | 0.20% | 0.051%(+0.153)#27 | 0.19%(+0.015)#2,114 |
| 28. | North Kensington | 0.20% | 0.051%(+0.150)#28 | 0.19%(+0.012)#2,127 |
| 29. | Gaithersburg | 0.18% | 0.051%(+0.132)#29 | 0.19%(-0.006)#2,214 |
| 30. | Glen Burnie | 0.17% | 0.051%(+0.123)#30 | 0.19%(-0.015)#2,259 |
| 31. | Lanham | 0.15% | 0.051%(+0.104)#31 | 0.19%(-0.034)#2,380 |
| 32. | Riverside | 0.14% | 0.051%(+0.084)#32 | 0.19%(-0.054)#2,491 |
| 33. | Odenton | 0.13% | 0.051%(+0.083)#33 | 0.19%(-0.055)#2,500 |
| 34. | Silver Spring | 0.13% | 0.051%(+0.075)#34 | 0.19%(-0.063)#2,552 |
| 35. | Bel Air South | 0.12% | 0.051%(+0.067)#35 | 0.19%(-0.071)#2,618 |
| 36. | Middle River | 0.12% | 0.051%(+0.065)#36 | 0.19%(-0.073)#2,632 |
| 37. | St James | 0.097% | 0.051%(+0.047)#37 | 0.19%(-0.091)#2,755 |
| 38. | Langley Park | 0.096% | 0.051%(+0.046)#38 | 0.19%(-0.092)#2,767 |
| 39. | Glassmanor | 0.086% | 0.051%(+0.036)#39 | 0.19%(-0.102)#2,846 |
| 40. | Hillandale | 0.080% | 0.051%(+0.029)#40 | 0.19%(-0.109)#2,900 |
| 41. | Elkridge | 0.079% | 0.051%(+0.029)#41 | 0.19%(-0.110)#2,907 |
| 42. | Ballenger Creek | 0.074% | 0.051%(+0.023)#42 | 0.19%(-0.115)#2,952 |
| 43. | Rock Hall | 0.069% | 0.051%(+0.018)#43 | 0.19%(-0.120)#3,009 |
| 44. | Clarksburg | 0.067% | 0.051%(+0.016)#44 | 0.19%(-0.122)#3,029 |
| 45. | Jessup | 0.062% | 0.051%(+0.012)#45 | 0.19%(-0.126)#3,071 |
| 46. | Green Valley | 0.062% | 0.051%(+0.011)#46 | 0.19%(-0.127)#3,081 |
| 47. | Columbia | 0.061% | 0.051%(+0.010)#47 | 0.19%(-0.128)#3,091 |
| 48. | Eldersburg | 0.056% | 0.051%(+0.005)#48 | 0.19%(-0.133)#3,144 |
| 49. | Wheaton | 0.049% | 0.051%(-0.001)#49 | 0.19%(-0.139)#3,214 |
| 50. | Towson | 0.047% | 0.051%(-0.004)#50 | 0.19%(-0.142)#3,240 |
| 51. | Potomac | 0.041% | 0.051%(-0.010)#51 | 0.19%(-0.148)#3,313 |
| 52. | Pikesville | 0.038% | 0.051%(-0.013)#52 | 0.19%(-0.151)#3,339 |
| 53. | Timonium | 0.037% | 0.051%(-0.014)#53 | 0.19%(-0.152)#3,358 |
| 54. | Baltimore | 0.031% | 0.051%(-0.020)#54 | 0.19%(-0.158)#3,427 |
| 55. | Bel Air North | 0.029% | 0.051%(-0.022)#55 | 0.19%(-0.160)#3,461 |
| 56. | Frederick | 0.028% | 0.051%(-0.023)#56 | 0.19%(-0.161)#3,473 |
| 57. | Milford Mill | 0.025% | 0.051%(-0.025)#57 | 0.19%(-0.163)#3,514 |
| 58. | Ellicott City | 0.024% | 0.051%(-0.026)#58 | 0.19%(-0.164)#3,525 |
| 59. | College Park | 0.023% | 0.051%(-0.027)#59 | 0.19%(-0.165)#3,545 |
| 60. | Waldorf | 0.021% | 0.051%(-0.030)#60 | 0.19%(-0.168)#3,577 |
| 61. | Glenn Dale | 0.020% | 0.051%(-0.031)#61 | 0.19%(-0.169)#3,596 |
| 62. | Westminster | 0.015% | 0.051%(-0.036)#62 | 0.19%(-0.174)#3,657 |
| 63. | Randallstown | 0.014% | 0.051%(-0.037)#63 | 0.19%(-0.175)#3,671 |
| 64. | North Bethesda | 0.0040% | 0.051%(-0.047)#64 | 0.19%(-0.185)#3,780 |
| 65. | Bethesda | 0.0030% | 0.051%(-0.048)#65 | 0.19%(-0.186)#3,796 |
Common Questions
What are the Top 10 Cities with the Highest Percentage of Hawaiian / Pacific Population in Maryland?
Top 10 Cities with the Highest Percentage of Hawaiian / Pacific Population in Maryland are:
#1
2.9%
#2
2.7%
#3
2.4%
#4
1.9%
#5
1.8%
#6
1.3%
#7
1.1%
#8
1.0%
#9
0.62%
#10
0.45%
What city has the Highest Percentage of Hawaiian / Pacific Population in Maryland?
Mount Lena has the Highest Percentage of Hawaiian / Pacific Population in Maryland with 2.9%.
What is the Percentage of Hawaiian / Pacific Population in the State of Maryland?
Percentage of Hawaiian / Pacific Population in Maryland is 0.051%.
What is the Percentage of Hawaiian / Pacific Population in the United States?
Percentage of Hawaiian / Pacific Population in the United States is 0.19%.