Afghan vs Norwegian Child Poverty Among Girls Under 16
COMPARE
Afghan
Norwegian
Child Poverty Among Girls Under 16
Child Poverty Among Girls Under 16 Comparison
Afghans
Norwegians
16.2%
CHILD POVERTY AMONG GIRLS UNDER 16
62.3/ 100
METRIC RATING
172nd/ 347
METRIC RANK
13.3%
CHILD POVERTY AMONG GIRLS UNDER 16
99.9/ 100
METRIC RATING
23rd/ 347
METRIC RANK
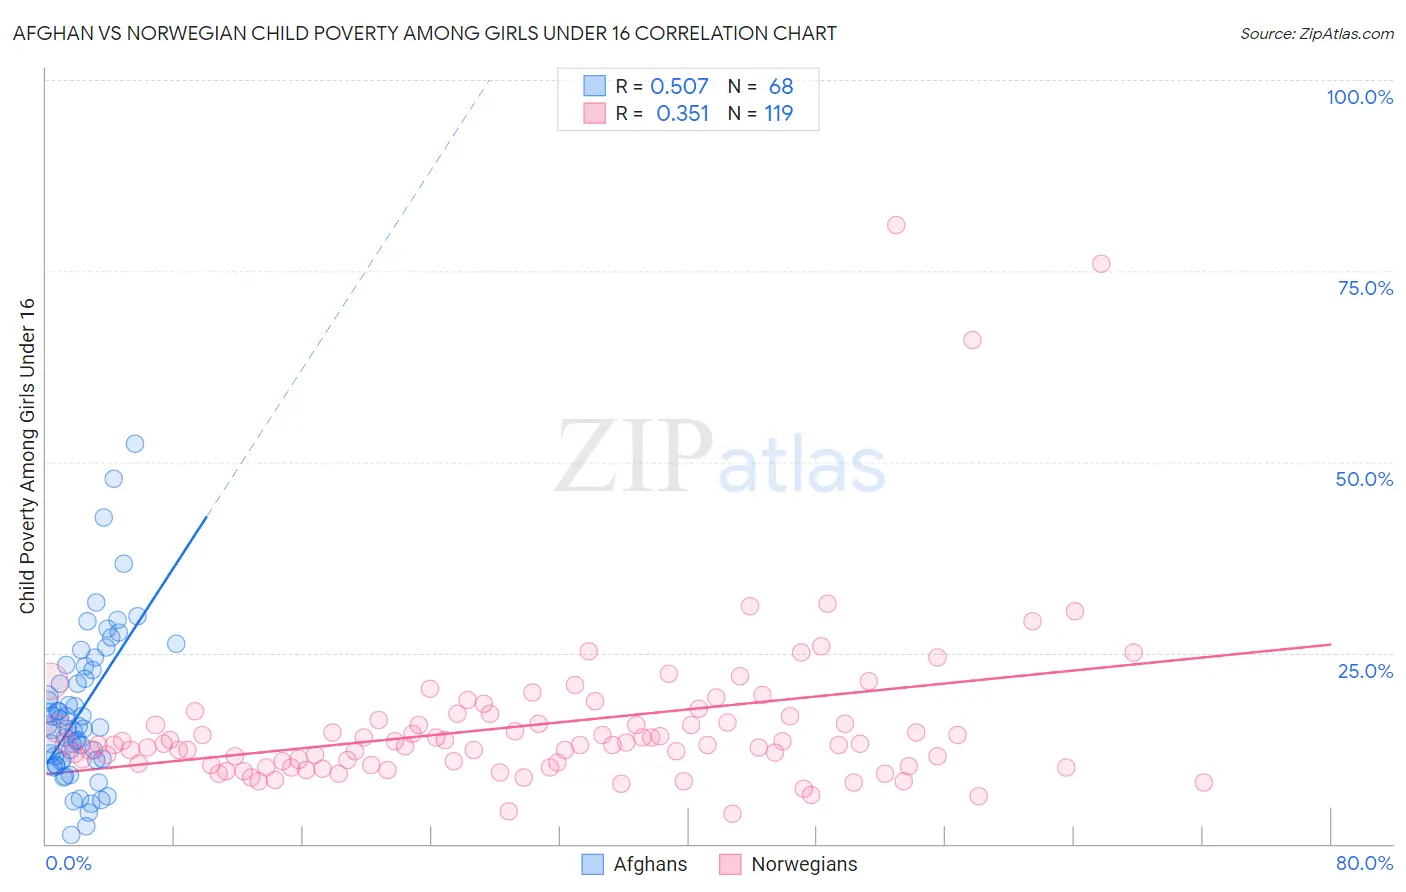
Afghan vs Norwegian Child Poverty Among Girls Under 16 Correlation Chart
The statistical analysis conducted on geographies consisting of 147,871,316 people shows a substantial positive correlation between the proportion of Afghans and poverty level among girls under the age of 16 in the United States with a correlation coefficient (R) of 0.507 and weighted average of 16.2%. Similarly, the statistical analysis conducted on geographies consisting of 514,648,663 people shows a mild positive correlation between the proportion of Norwegians and poverty level among girls under the age of 16 in the United States with a correlation coefficient (R) of 0.351 and weighted average of 13.3%, a difference of 21.6%.
Child Poverty Among Girls Under 16 Correlation Summary
| Measurement | Afghan | Norwegian |
| Minimum | 1.2% | 3.9% |
| Maximum | 52.3% | 81.0% |
| Range | 51.1% | 77.1% |
| Mean | 17.5% | 15.5% |
| Median | 15.3% | 13.0% |
| Interquartile 25% (IQ1) | 11.0% | 10.4% |
| Interquartile 75% (IQ3) | 23.0% | 16.2% |
| Interquartile Range (IQR) | 12.0% | 5.8% |
| Standard Deviation (Sample) | 10.0% | 10.9% |
| Standard Deviation (Population) | 10.0% | 10.9% |
Similar Demographics by Child Poverty Among Girls Under 16
Demographics Similar to Afghans by Child Poverty Among Girls Under 16
In terms of child poverty among girls under 16, the demographic groups most similar to Afghans are Immigrants from Saudi Arabia (16.2%, a difference of 0.21%), Costa Rican (16.2%, a difference of 0.24%), Immigrants from Venezuela (16.2%, a difference of 0.24%), Yugoslavian (16.2%, a difference of 0.26%), and Uruguayan (16.2%, a difference of 0.30%).
| Demographics | Rating | Rank | Child Poverty Among Girls Under 16 |
| Immigrants | Germany | 67.3 /100 | #165 | Good 16.1% |
| South Americans | 67.2 /100 | #166 | Good 16.1% |
| Uruguayans | 64.7 /100 | #167 | Good 16.2% |
| Yugoslavians | 64.4 /100 | #168 | Good 16.2% |
| Costa Ricans | 64.2 /100 | #169 | Good 16.2% |
| Immigrants | Venezuela | 64.2 /100 | #170 | Good 16.2% |
| Immigrants | Saudi Arabia | 64.0 /100 | #171 | Good 16.2% |
| Afghans | 62.3 /100 | #172 | Good 16.2% |
| Immigrants | South America | 55.1 /100 | #173 | Average 16.4% |
| Ethiopians | 50.0 /100 | #174 | Average 16.5% |
| Lebanese | 45.4 /100 | #175 | Average 16.6% |
| Hungarians | 45.1 /100 | #176 | Average 16.6% |
| Immigrants | Western Asia | 44.1 /100 | #177 | Average 16.6% |
| Whites/Caucasians | 43.6 /100 | #178 | Average 16.6% |
| Hawaiians | 43.4 /100 | #179 | Average 16.6% |
Demographics Similar to Norwegians by Child Poverty Among Girls Under 16
In terms of child poverty among girls under 16, the demographic groups most similar to Norwegians are Immigrants from Eastern Asia (13.4%, a difference of 0.090%), Indian (Asian) (13.3%, a difference of 0.17%), Assyrian/Chaldean/Syriac (13.3%, a difference of 0.37%), Immigrants from Japan (13.3%, a difference of 0.49%), and Immigrants from China (13.4%, a difference of 0.55%).
| Demographics | Rating | Rank | Child Poverty Among Girls Under 16 |
| Immigrants | Lithuania | 99.9 /100 | #16 | Exceptional 13.1% |
| Bulgarians | 99.9 /100 | #17 | Exceptional 13.1% |
| Immigrants | Korea | 99.9 /100 | #18 | Exceptional 13.1% |
| Cypriots | 99.9 /100 | #19 | Exceptional 13.2% |
| Immigrants | Japan | 99.9 /100 | #20 | Exceptional 13.3% |
| Assyrians/Chaldeans/Syriacs | 99.9 /100 | #21 | Exceptional 13.3% |
| Indians (Asian) | 99.9 /100 | #22 | Exceptional 13.3% |
| Norwegians | 99.9 /100 | #23 | Exceptional 13.3% |
| Immigrants | Eastern Asia | 99.9 /100 | #24 | Exceptional 13.4% |
| Immigrants | China | 99.8 /100 | #25 | Exceptional 13.4% |
| Eastern Europeans | 99.8 /100 | #26 | Exceptional 13.5% |
| Latvians | 99.8 /100 | #27 | Exceptional 13.5% |
| Tongans | 99.8 /100 | #28 | Exceptional 13.6% |
| Bolivians | 99.8 /100 | #29 | Exceptional 13.6% |
| Asians | 99.7 /100 | #30 | Exceptional 13.7% |