Shoshone vs Norwegian Child Poverty Among Girls Under 16
COMPARE
Shoshone
Norwegian
Child Poverty Among Girls Under 16
Child Poverty Among Girls Under 16 Comparison
Shoshone
Norwegians
18.9%
CHILD POVERTY AMONG GIRLS UNDER 16
0.6/ 100
METRIC RATING
245th/ 347
METRIC RANK
13.3%
CHILD POVERTY AMONG GIRLS UNDER 16
99.9/ 100
METRIC RATING
23rd/ 347
METRIC RANK
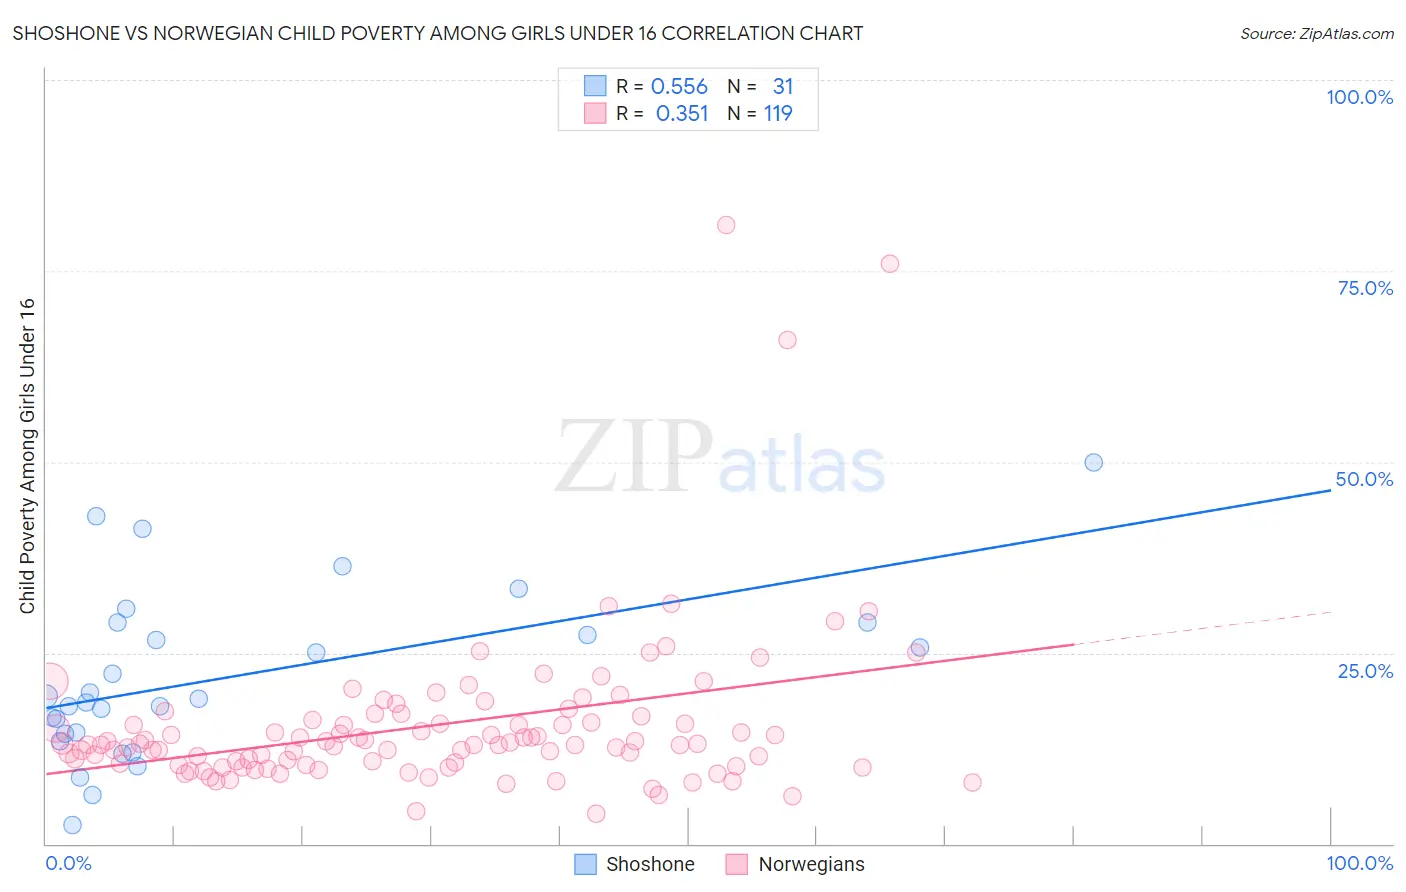
Shoshone vs Norwegian Child Poverty Among Girls Under 16 Correlation Chart
The statistical analysis conducted on geographies consisting of 66,320,610 people shows a substantial positive correlation between the proportion of Shoshone and poverty level among girls under the age of 16 in the United States with a correlation coefficient (R) of 0.556 and weighted average of 18.9%. Similarly, the statistical analysis conducted on geographies consisting of 514,648,663 people shows a mild positive correlation between the proportion of Norwegians and poverty level among girls under the age of 16 in the United States with a correlation coefficient (R) of 0.351 and weighted average of 13.3%, a difference of 41.3%.
Child Poverty Among Girls Under 16 Correlation Summary
| Measurement | Shoshone | Norwegian |
| Minimum | 2.5% | 3.9% |
| Maximum | 50.0% | 81.0% |
| Range | 47.5% | 77.1% |
| Mean | 21.8% | 15.5% |
| Median | 18.9% | 13.0% |
| Interquartile 25% (IQ1) | 14.4% | 10.4% |
| Interquartile 75% (IQ3) | 29.0% | 16.2% |
| Interquartile Range (IQR) | 14.6% | 5.8% |
| Standard Deviation (Sample) | 11.0% | 10.9% |
| Standard Deviation (Population) | 10.8% | 10.9% |
Similar Demographics by Child Poverty Among Girls Under 16
Demographics Similar to Shoshone by Child Poverty Among Girls Under 16
In terms of child poverty among girls under 16, the demographic groups most similar to Shoshone are Immigrants from Laos (18.9%, a difference of 0.030%), Ecuadorian (18.8%, a difference of 0.12%), Immigrants from Nicaragua (18.8%, a difference of 0.18%), Immigrants from Ghana (18.9%, a difference of 0.39%), and Immigrants from Cuba (18.8%, a difference of 0.40%).
| Demographics | Rating | Rank | Child Poverty Among Girls Under 16 |
| Immigrants | Eritrea | 1.0 /100 | #238 | Tragic 18.7% |
| Marshallese | 0.9 /100 | #239 | Tragic 18.7% |
| Nigerians | 0.9 /100 | #240 | Tragic 18.7% |
| Americans | 0.8 /100 | #241 | Tragic 18.8% |
| Immigrants | Cuba | 0.7 /100 | #242 | Tragic 18.8% |
| Immigrants | Nicaragua | 0.7 /100 | #243 | Tragic 18.8% |
| Ecuadorians | 0.7 /100 | #244 | Tragic 18.8% |
| Shoshone | 0.6 /100 | #245 | Tragic 18.9% |
| Immigrants | Laos | 0.6 /100 | #246 | Tragic 18.9% |
| Immigrants | Ghana | 0.5 /100 | #247 | Tragic 18.9% |
| French American Indians | 0.3 /100 | #248 | Tragic 19.2% |
| Potawatomi | 0.3 /100 | #249 | Tragic 19.2% |
| Cape Verdeans | 0.3 /100 | #250 | Tragic 19.2% |
| Immigrants | Trinidad and Tobago | 0.3 /100 | #251 | Tragic 19.2% |
| Immigrants | Middle Africa | 0.3 /100 | #252 | Tragic 19.2% |
Demographics Similar to Norwegians by Child Poverty Among Girls Under 16
In terms of child poverty among girls under 16, the demographic groups most similar to Norwegians are Immigrants from Eastern Asia (13.4%, a difference of 0.090%), Indian (Asian) (13.3%, a difference of 0.17%), Assyrian/Chaldean/Syriac (13.3%, a difference of 0.37%), Immigrants from Japan (13.3%, a difference of 0.49%), and Immigrants from China (13.4%, a difference of 0.55%).
| Demographics | Rating | Rank | Child Poverty Among Girls Under 16 |
| Immigrants | Lithuania | 99.9 /100 | #16 | Exceptional 13.1% |
| Bulgarians | 99.9 /100 | #17 | Exceptional 13.1% |
| Immigrants | Korea | 99.9 /100 | #18 | Exceptional 13.1% |
| Cypriots | 99.9 /100 | #19 | Exceptional 13.2% |
| Immigrants | Japan | 99.9 /100 | #20 | Exceptional 13.3% |
| Assyrians/Chaldeans/Syriacs | 99.9 /100 | #21 | Exceptional 13.3% |
| Indians (Asian) | 99.9 /100 | #22 | Exceptional 13.3% |
| Norwegians | 99.9 /100 | #23 | Exceptional 13.3% |
| Immigrants | Eastern Asia | 99.9 /100 | #24 | Exceptional 13.4% |
| Immigrants | China | 99.8 /100 | #25 | Exceptional 13.4% |
| Eastern Europeans | 99.8 /100 | #26 | Exceptional 13.5% |
| Latvians | 99.8 /100 | #27 | Exceptional 13.5% |
| Tongans | 99.8 /100 | #28 | Exceptional 13.6% |
| Bolivians | 99.8 /100 | #29 | Exceptional 13.6% |
| Asians | 99.7 /100 | #30 | Exceptional 13.7% |