Immigrants from Bosnia and Herzegovina vs Immigrants from Honduras Female Poverty
COMPARE
Immigrants from Bosnia and Herzegovina
Immigrants from Honduras
Female Poverty
Female Poverty Comparison
Immigrants from Bosnia and Herzegovina
Immigrants from Honduras
13.2%
FEMALE POVERTY
69.7/ 100
METRIC RATING
156th/ 347
METRIC RANK
17.7%
FEMALE POVERTY
0.0/ 100
METRIC RATING
324th/ 347
METRIC RANK
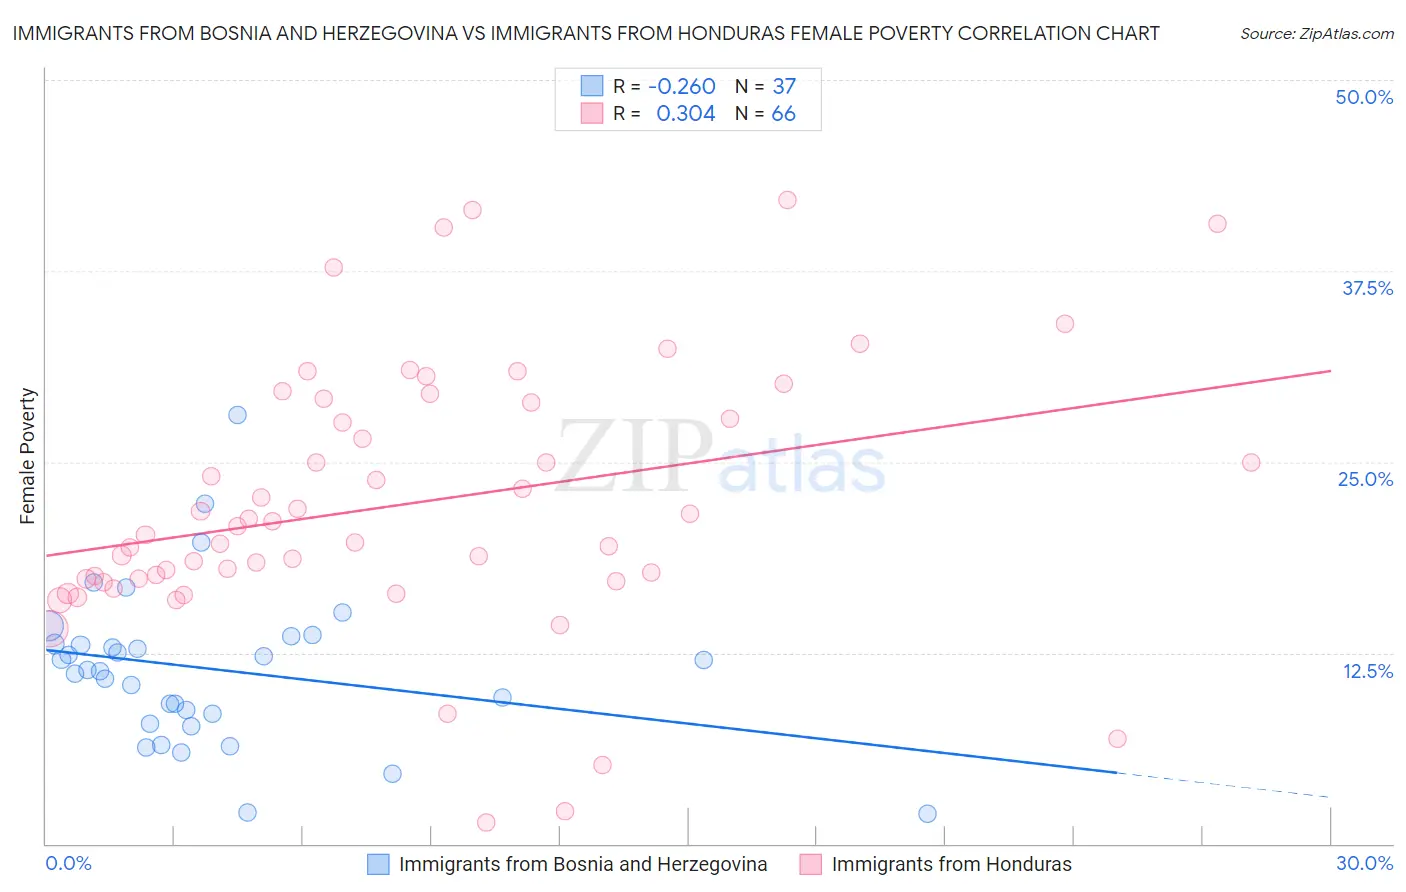
Immigrants from Bosnia and Herzegovina vs Immigrants from Honduras Female Poverty Correlation Chart
The statistical analysis conducted on geographies consisting of 156,760,693 people shows a weak negative correlation between the proportion of Immigrants from Bosnia and Herzegovina and poverty level among females in the United States with a correlation coefficient (R) of -0.260 and weighted average of 13.2%. Similarly, the statistical analysis conducted on geographies consisting of 322,443,203 people shows a mild positive correlation between the proportion of Immigrants from Honduras and poverty level among females in the United States with a correlation coefficient (R) of 0.304 and weighted average of 17.7%, a difference of 34.6%.
Female Poverty Correlation Summary
| Measurement | Immigrants from Bosnia and Herzegovina | Immigrants from Honduras |
| Minimum | 2.0% | 1.4% |
| Maximum | 28.1% | 42.1% |
| Range | 26.1% | 40.7% |
| Mean | 11.4% | 22.2% |
| Median | 11.4% | 20.5% |
| Interquartile 25% (IQ1) | 8.2% | 17.4% |
| Interquartile 75% (IQ3) | 13.3% | 28.9% |
| Interquartile Range (IQR) | 5.1% | 11.5% |
| Standard Deviation (Sample) | 5.2% | 8.7% |
| Standard Deviation (Population) | 5.1% | 8.6% |
Similar Demographics by Female Poverty
Demographics Similar to Immigrants from Bosnia and Herzegovina by Female Poverty
In terms of female poverty, the demographic groups most similar to Immigrants from Bosnia and Herzegovina are Hungarian (13.2%, a difference of 0.050%), Armenian (13.2%, a difference of 0.090%), Immigrants from Northern Africa (13.2%, a difference of 0.10%), Immigrants from Fiji (13.2%, a difference of 0.15%), and Pennsylvania German (13.2%, a difference of 0.27%).
| Demographics | Rating | Rank | Female Poverty |
| Taiwanese | 75.7 /100 | #149 | Good 13.1% |
| Tsimshian | 75.5 /100 | #150 | Good 13.1% |
| Immigrants | Germany | 74.9 /100 | #151 | Good 13.1% |
| Samoans | 73.6 /100 | #152 | Good 13.1% |
| Immigrants | Fiji | 71.0 /100 | #153 | Good 13.2% |
| Armenians | 70.4 /100 | #154 | Good 13.2% |
| Hungarians | 70.1 /100 | #155 | Good 13.2% |
| Immigrants | Bosnia and Herzegovina | 69.7 /100 | #156 | Good 13.2% |
| Immigrants | Northern Africa | 68.8 /100 | #157 | Good 13.2% |
| Pennsylvania Germans | 67.3 /100 | #158 | Good 13.2% |
| Costa Ricans | 63.6 /100 | #159 | Good 13.3% |
| Immigrants | Nepal | 62.7 /100 | #160 | Good 13.3% |
| Immigrants | Ethiopia | 62.5 /100 | #161 | Good 13.3% |
| Guamanians/Chamorros | 62.4 /100 | #162 | Good 13.3% |
| Immigrants | Albania | 62.4 /100 | #163 | Good 13.3% |
Demographics Similar to Immigrants from Honduras by Female Poverty
In terms of female poverty, the demographic groups most similar to Immigrants from Honduras are Colville (17.8%, a difference of 0.15%), Paiute (17.7%, a difference of 0.18%), Menominee (17.6%, a difference of 0.77%), Arapaho (17.5%, a difference of 1.4%), and Immigrants from Dominica (17.5%, a difference of 1.5%).
| Demographics | Rating | Rank | Female Poverty |
| Immigrants | Congo | 0.0 /100 | #317 | Tragic 17.4% |
| Ute | 0.0 /100 | #318 | Tragic 17.5% |
| Cajuns | 0.0 /100 | #319 | Tragic 17.5% |
| Immigrants | Dominica | 0.0 /100 | #320 | Tragic 17.5% |
| Arapaho | 0.0 /100 | #321 | Tragic 17.5% |
| Menominee | 0.0 /100 | #322 | Tragic 17.6% |
| Paiute | 0.0 /100 | #323 | Tragic 17.7% |
| Immigrants | Honduras | 0.0 /100 | #324 | Tragic 17.7% |
| Colville | 0.0 /100 | #325 | Tragic 17.8% |
| Central American Indians | 0.0 /100 | #326 | Tragic 18.0% |
| Yakama | 0.0 /100 | #327 | Tragic 18.0% |
| Blacks/African Americans | 0.0 /100 | #328 | Tragic 18.6% |
| Kiowa | 0.0 /100 | #329 | Tragic 18.6% |
| Dominicans | 0.0 /100 | #330 | Tragic 19.1% |
| Natives/Alaskans | 0.0 /100 | #331 | Tragic 19.2% |