Immigrants from Malaysia vs Chinese Single Mother Poverty
COMPARE
Immigrants from Malaysia
Chinese
Single Mother Poverty
Single Mother Poverty Comparison
Immigrants from Malaysia
Chinese
27.3%
SINGLE MOTHER POVERTY
99.5/ 100
METRIC RATING
62nd/ 347
METRIC RANK
24.6%
SINGLE MOTHER POVERTY
100.0/ 100
METRIC RATING
7th/ 347
METRIC RANK
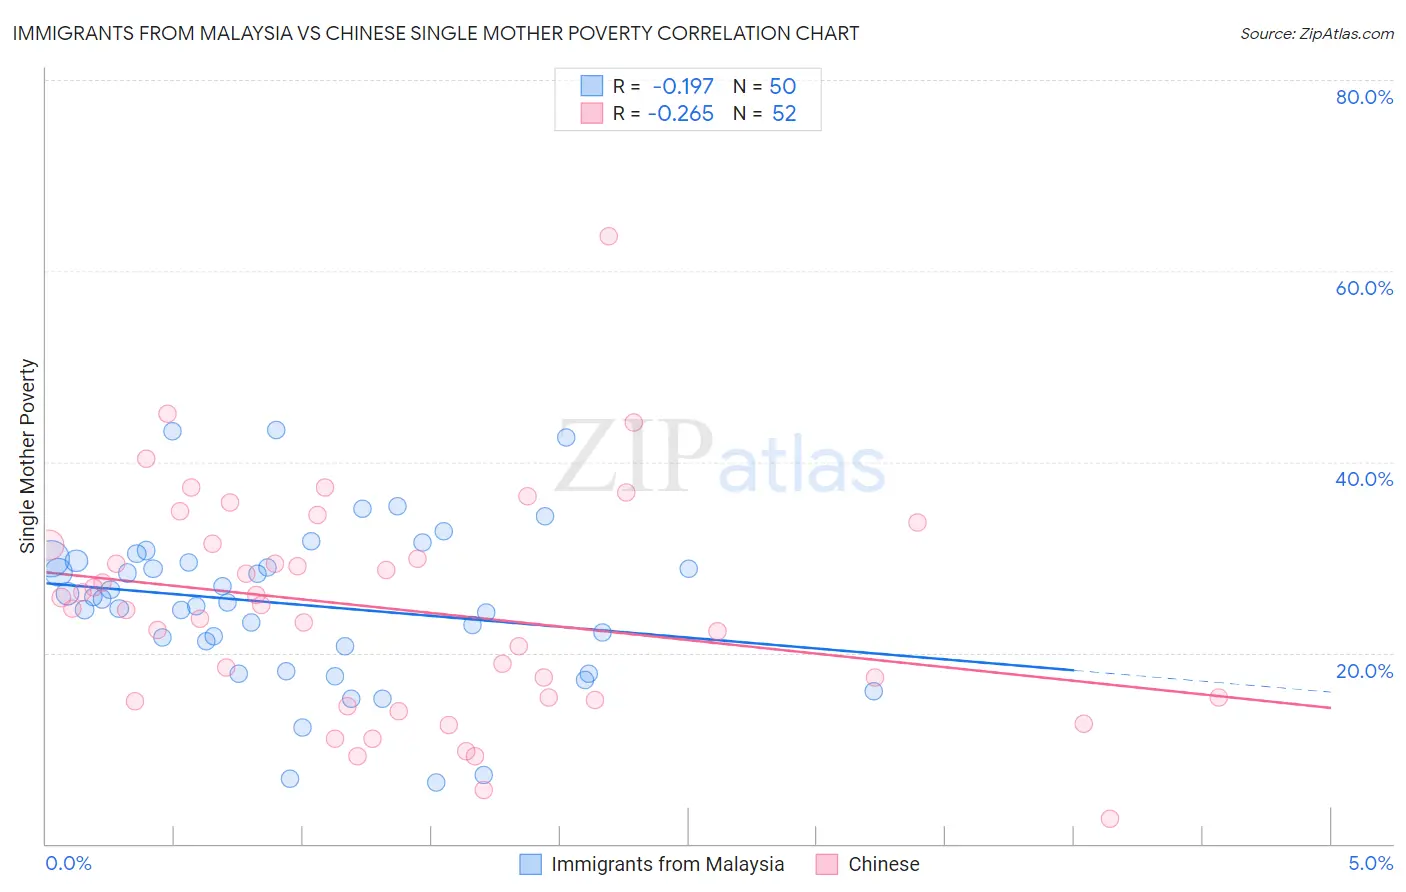
Immigrants from Malaysia vs Chinese Single Mother Poverty Correlation Chart
The statistical analysis conducted on geographies consisting of 194,970,165 people shows a poor negative correlation between the proportion of Immigrants from Malaysia and poverty level among single mothers in the United States with a correlation coefficient (R) of -0.197 and weighted average of 27.3%. Similarly, the statistical analysis conducted on geographies consisting of 64,411,570 people shows a weak negative correlation between the proportion of Chinese and poverty level among single mothers in the United States with a correlation coefficient (R) of -0.265 and weighted average of 24.6%, a difference of 10.8%.
Single Mother Poverty Correlation Summary
| Measurement | Immigrants from Malaysia | Chinese |
| Minimum | 6.4% | 2.6% |
| Maximum | 43.4% | 63.6% |
| Range | 37.0% | 61.1% |
| Mean | 25.0% | 24.6% |
| Median | 25.4% | 24.8% |
| Interquartile 25% (IQ1) | 20.7% | 15.2% |
| Interquartile 75% (IQ3) | 29.6% | 31.4% |
| Interquartile Range (IQR) | 9.0% | 16.2% |
| Standard Deviation (Sample) | 8.3% | 11.6% |
| Standard Deviation (Population) | 8.3% | 11.4% |
Similar Demographics by Single Mother Poverty
Demographics Similar to Immigrants from Malaysia by Single Mother Poverty
In terms of single mother poverty, the demographic groups most similar to Immigrants from Malaysia are Immigrants from Northern Europe (27.3%, a difference of 0.050%), Russian (27.3%, a difference of 0.080%), Immigrants from Eastern Europe (27.2%, a difference of 0.14%), Immigrants from Turkey (27.3%, a difference of 0.16%), and Soviet Union (27.3%, a difference of 0.19%).
| Demographics | Rating | Rank | Single Mother Poverty |
| Immigrants | Egypt | 99.7 /100 | #55 | Exceptional 27.1% |
| Immigrants | Romania | 99.7 /100 | #56 | Exceptional 27.2% |
| Palestinians | 99.7 /100 | #57 | Exceptional 27.2% |
| Argentineans | 99.6 /100 | #58 | Exceptional 27.2% |
| Paraguayans | 99.6 /100 | #59 | Exceptional 27.2% |
| Eastern Europeans | 99.6 /100 | #60 | Exceptional 27.2% |
| Immigrants | Eastern Europe | 99.6 /100 | #61 | Exceptional 27.2% |
| Immigrants | Malaysia | 99.5 /100 | #62 | Exceptional 27.3% |
| Immigrants | Northern Europe | 99.5 /100 | #63 | Exceptional 27.3% |
| Russians | 99.5 /100 | #64 | Exceptional 27.3% |
| Immigrants | Turkey | 99.5 /100 | #65 | Exceptional 27.3% |
| Soviet Union | 99.5 /100 | #66 | Exceptional 27.3% |
| Immigrants | Australia | 99.5 /100 | #67 | Exceptional 27.3% |
| Immigrants | Czechoslovakia | 99.5 /100 | #68 | Exceptional 27.4% |
| Lithuanians | 99.4 /100 | #69 | Exceptional 27.4% |
Demographics Similar to Chinese by Single Mother Poverty
In terms of single mother poverty, the demographic groups most similar to Chinese are Thai (24.5%, a difference of 0.54%), Immigrants from Hong Kong (24.4%, a difference of 1.0%), Filipino (24.3%, a difference of 1.3%), Immigrants from Iran (25.1%, a difference of 2.0%), and Immigrants from Lithuania (25.2%, a difference of 2.4%).
| Demographics | Rating | Rank | Single Mother Poverty |
| Assyrians/Chaldeans/Syriacs | 100.0 /100 | #1 | Exceptional 23.8% |
| Immigrants | India | 100.0 /100 | #2 | Exceptional 23.8% |
| Immigrants | Taiwan | 100.0 /100 | #3 | Exceptional 23.9% |
| Filipinos | 100.0 /100 | #4 | Exceptional 24.3% |
| Immigrants | Hong Kong | 100.0 /100 | #5 | Exceptional 24.4% |
| Thais | 100.0 /100 | #6 | Exceptional 24.5% |
| Chinese | 100.0 /100 | #7 | Exceptional 24.6% |
| Immigrants | Iran | 100.0 /100 | #8 | Exceptional 25.1% |
| Immigrants | Lithuania | 100.0 /100 | #9 | Exceptional 25.2% |
| Immigrants | South Central Asia | 100.0 /100 | #10 | Exceptional 25.3% |
| Iranians | 100.0 /100 | #11 | Exceptional 25.5% |
| Bhutanese | 100.0 /100 | #12 | Exceptional 25.6% |
| Indians (Asian) | 100.0 /100 | #13 | Exceptional 25.8% |
| Immigrants | Singapore | 100.0 /100 | #14 | Exceptional 25.8% |
| Immigrants | Ireland | 100.0 /100 | #15 | Exceptional 25.8% |