Polish vs Immigrants from Cambodia Child Poverty Under the Age of 16
COMPARE
Polish
Immigrants from Cambodia
Child Poverty Under the Age of 16
Child Poverty Under the Age of 16 Comparison
Poles
Immigrants from Cambodia
14.0%
CHILD POVERTY UNDER THE AGE OF 16
98.9/ 100
METRIC RATING
52nd/ 347
METRIC RANK
17.8%
CHILD POVERTY UNDER THE AGE OF 16
3.3/ 100
METRIC RATING
223rd/ 347
METRIC RANK
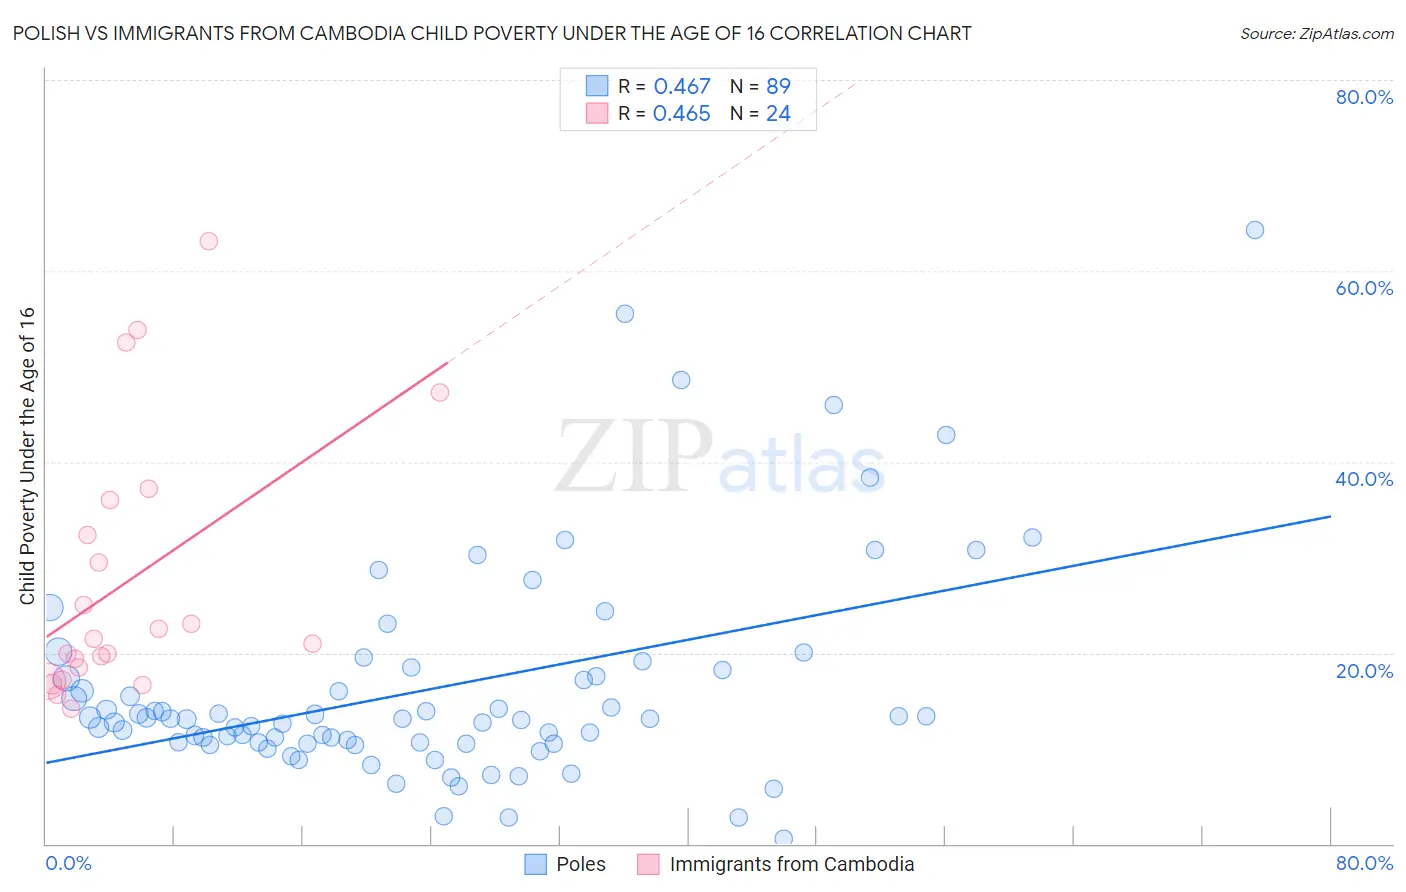
Polish vs Immigrants from Cambodia Child Poverty Under the Age of 16 Correlation Chart
The statistical analysis conducted on geographies consisting of 547,911,563 people shows a moderate positive correlation between the proportion of Poles and poverty level among children under the age of 16 in the United States with a correlation coefficient (R) of 0.467 and weighted average of 14.0%. Similarly, the statistical analysis conducted on geographies consisting of 204,722,990 people shows a moderate positive correlation between the proportion of Immigrants from Cambodia and poverty level among children under the age of 16 in the United States with a correlation coefficient (R) of 0.465 and weighted average of 17.8%, a difference of 27.1%.
Child Poverty Under the Age of 16 Correlation Summary
| Measurement | Polish | Immigrants from Cambodia |
| Minimum | 0.49% | 14.1% |
| Maximum | 64.3% | 63.1% |
| Range | 63.8% | 48.9% |
| Mean | 16.3% | 27.5% |
| Median | 13.1% | 21.2% |
| Interquartile 25% (IQ1) | 10.6% | 17.8% |
| Interquartile 75% (IQ3) | 17.8% | 34.2% |
| Interquartile Range (IQR) | 7.3% | 16.4% |
| Standard Deviation (Sample) | 11.2% | 13.8% |
| Standard Deviation (Population) | 11.2% | 13.5% |
Similar Demographics by Child Poverty Under the Age of 16
Demographics Similar to Poles by Child Poverty Under the Age of 16
In terms of child poverty under the age of 16, the demographic groups most similar to Poles are Immigrants from Israel (14.1%, a difference of 0.31%), Tsimshian (14.1%, a difference of 0.34%), Immigrants from Indonesia (14.1%, a difference of 0.40%), Immigrants from Serbia (14.1%, a difference of 0.58%), and Immigrants from Belgium (14.1%, a difference of 0.66%).
| Demographics | Rating | Rank | Child Poverty Under the Age of 16 |
| Czechs | 99.3 /100 | #45 | Exceptional 13.8% |
| Immigrants | Asia | 99.2 /100 | #46 | Exceptional 13.8% |
| Estonians | 99.2 /100 | #47 | Exceptional 13.9% |
| Koreans | 99.2 /100 | #48 | Exceptional 13.9% |
| Italians | 99.2 /100 | #49 | Exceptional 13.9% |
| Immigrants | Czechoslovakia | 99.1 /100 | #50 | Exceptional 13.9% |
| Immigrants | Greece | 99.1 /100 | #51 | Exceptional 13.9% |
| Poles | 98.9 /100 | #52 | Exceptional 14.0% |
| Immigrants | Israel | 98.8 /100 | #53 | Exceptional 14.1% |
| Tsimshian | 98.8 /100 | #54 | Exceptional 14.1% |
| Immigrants | Indonesia | 98.7 /100 | #55 | Exceptional 14.1% |
| Immigrants | Serbia | 98.7 /100 | #56 | Exceptional 14.1% |
| Immigrants | Belgium | 98.6 /100 | #57 | Exceptional 14.1% |
| Immigrants | Pakistan | 98.6 /100 | #58 | Exceptional 14.1% |
| Scandinavians | 98.6 /100 | #59 | Exceptional 14.1% |
Demographics Similar to Immigrants from Cambodia by Child Poverty Under the Age of 16
In terms of child poverty under the age of 16, the demographic groups most similar to Immigrants from Cambodia are Immigrants from Armenia (17.8%, a difference of 0.24%), Osage (17.9%, a difference of 0.24%), Cuban (17.8%, a difference of 0.30%), Immigrants from Panama (17.7%, a difference of 0.57%), and Nonimmigrants (17.9%, a difference of 0.60%).
| Demographics | Rating | Rank | Child Poverty Under the Age of 16 |
| Sierra Leoneans | 5.7 /100 | #216 | Tragic 17.6% |
| Immigrants | Eastern Africa | 5.3 /100 | #217 | Tragic 17.6% |
| Moroccans | 5.3 /100 | #218 | Tragic 17.6% |
| Japanese | 4.7 /100 | #219 | Tragic 17.7% |
| Immigrants | Panama | 4.1 /100 | #220 | Tragic 17.7% |
| Cubans | 3.7 /100 | #221 | Tragic 17.8% |
| Immigrants | Armenia | 3.6 /100 | #222 | Tragic 17.8% |
| Immigrants | Cambodia | 3.3 /100 | #223 | Tragic 17.8% |
| Osage | 3.1 /100 | #224 | Tragic 17.9% |
| Immigrants | Nonimmigrants | 2.7 /100 | #225 | Tragic 17.9% |
| Bermudans | 2.6 /100 | #226 | Tragic 18.0% |
| Immigrants | Africa | 2.5 /100 | #227 | Tragic 18.0% |
| Immigrants | Micronesia | 2.3 /100 | #228 | Tragic 18.0% |
| Marshallese | 1.8 /100 | #229 | Tragic 18.1% |
| Nepalese | 1.7 /100 | #230 | Tragic 18.2% |